Posts related to Telegraf data collection

Capturing Temperature of Govee Bluetooth Sensors

I have an quite a few Govee temperature and humidity sensors. They’re reasonably priced, quite accurate, and they’re bluetooth LE. Yes, that allows them to sip power but at a cost that I cannot reach them when outside of home. Well, unless I get one of Govee hubs and connect them to cloud. But, is there a way to bypass the cloud and push all to my telegraf instance? Well, now there is!

First of all, why Telegraf? Obvious answer is because I have it already setup in my network and connected with my Grafana GUI. Longer answer is because I like the idea of telegraf. You have a centralized database and pushing to it is as easy as sending HTTP request. Everything is quite free-form and any mess you create is sorted out when data is displayed in Grafana.

Next question is, how? Well, I originally planned to roll my own script by abusing bluetoothctl scripting. However, during research I fount out that gentleman named William C Bonner already did pretty much the exact thing I wanted to. His GoveeBTTempLogger already both captures and decodes Govee temperature and humidity data.

And yes, there is no x64 package precompiled but, surprisingly, README.md instructions actually work. That said, I opted to build binaries a bit differently. This allowed me to install binary into /usr/local/bin/.

sudo apt install build-essential cmake git libbluetooth-dev libdbus-1-dev
git clone https://github.com/wcbonner/GoveeBTTempLogger.git
cd GoveeBTTempLogger
cmake -B ./build
sudo cmake --build ./build --target install

Once compiled, we can start application and, hopefully, see all the temperatures.

goveebttemplogger

And, if you just want to see the current values, that’s enough. If you check into README.md a bit more, you can also setup application to output web pages. Unfortunately, there is no telegraf output option. Or thankfully, since this gives me option to roll my own script around this nice tool.

What I ended up with is the following.

TG_HOST=<ip>
TG_PORT=<port>
TG_BUCKET=<bucket>
TG_USERNAME=<user>
TG_PASSWORD=<password>

while IFS= read -r LINE; do
  DATA=`echo "$LINE" | grep '(Temp)' | grep '(Humidity)' | grep '(Battery)'`
  if [ "$DATA" == "" ]; then continue; fi

  DEVICE=`echo $DATA | awk '{print $2}' | tr -d '[]'`
  TEMPERATURE=`echo $DATA | awk '{print $4}' | tr -dc '0-9.'`
  HUMIDITY=`echo $DATA | awk '{print $6}' | tr -dc '0-9.'`
  BATTERY=`echo $DATA | awk '{print $8}' | tr -dc '0-9.'`

  printf "%s %5s°C %4s%% %3s%%\n" $DEVICE $TEMPERATURE $HUMIDITY $BATTERY
  CONTENT="temp,device=$DEVICE temp=${TEMPERATURE},humidity=${HUMIDITY},battery=${BATTERY} `date +%s`"$'\n'
  CONTENT_LEN=$(echo -en ${CONTENT} | wc -c)
  echo -ne "POST /api/v2/write?u=$TG_USERNAME&p=$TG_PASSWORD&bucket=${TG_BUCKET}&precision=s HTTP/1.0\r\nHost: $TG_HOST\r\nContent-Type: application/x-www-form-urlencoded\r\nContent-Length: ${CONTENT_LEN}\r\n\r\n${CONTENT}" | nc -w 15 $TG_HOST $TG_PORT
done < <(/usr/local/bin/goveebttemplogger --passive)

This script goes over goveebttemplogger output and extracts device MAC address and its data. That data is then packed into Telegrafs line format and simply posted into nc as raw HTTP output. Not more difficult than wget or curl.

Wrapping this into a service so it runs in the background is an exercise left to the reader.

Counting Geigers

Illustration

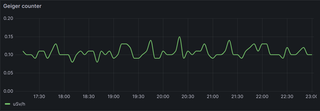
A long while ago I got myself a Geiger counter, soldered it together, stored it in a drawer, and forgot about it for literally more than a year. However, once I found it again, I did the only thing that could be done - I connected it to a computer and decided to track its values.

My default approach would usually be to create an application to track it. But, since I connected it to a Linux server, it seemed appropriate to merge this functionality into a bash script that already sends ZFS data to my telegraf server.

Since my Geiger counter has UART output, the natural way of collecting its output under Linux was a simple cat command:

cat /dev/ttyUSB0

That gave me a constant output of readings, about once a second:

CPS, 0, CPM, 12, uSv/hr, 0.06, SLOW

CPS, 1, CPM, 13, uSv/hr, 0.07, SLOW

CPS, 0, CPM, 13, uSv/hr, 0.07, SLOW

CPS, 1, CPM, 14, uSv/hr, 0.07, SLOW

CPS, 1, CPM, 15, uSv/hr, 0.08, SLOW

CPS, 0, CPM, 15, uSv/hr, 0.08, SLOW

In order to parse this line easier, I wanted two things. First, to remove extra empty lines caused by CRLF line ending, and secondly to have all values separated by a single space. Simple adjustment sorted that out:

cat /dev/ttyUSB0 | sed '/^$/d' | tr -d ','

While this actually gave me a perfectly usable stream of data, it would never exit. It would just keep showing new data. Perfectly suitable for some uses, but I wanted my script just to take the last data once a minute and be done with it. And no, you cannot just use tail command alone for this - it needs to be combined with something that will stop the stream - like timeout.

timeout --foreground 1 cat /dev/ttyUSB0 | sed '/^$/d' | tr -d ',' | tail -1

If we place this into a variable, we can extract specific values - I just ended up using uSv/h but the exact value might depend on your use case.

OUTPUT=`timeout --foreground 1 cat /dev/ttyUSB0 | sed '/^$/d' | tr -d ',' | tail -1`
CPS=`echo $OUTPUT | awk '{print $2}'`
CPM=`echo $OUTPUT | awk '{print $4}'`
USVHR=`echo $OUTPUT | awk '{print $6}'`
MODE=`echo $OUTPUT | awk '{print $7}'`

With those variables in hand, you can feed whatever upstream data sink you want.

Basic XigmaNAS Stats for InfluxDB

My home monitoring included pretty much anything I wanted to see with one exception - my backup NAS. You see, I use embedded XigmaNAS for my backup server and getting telegraf client onto it is problematic at best. However, who needs Telegraf client anyhow?

Collecting stats themselves is easy enough. Basic CPU stats you get from Telegraf client usually can be easily read via command line tools. As long as you keep the same tags and fields as what Telegraf usually sends you can nicely mingle our manually collected stats with what proper client sends.

And how do we send it? Telegram protocol is essentially just a set of lines pushed using HTTP POST. Yes, if you have a bit more secure system, it’s probably HTTPS and it might even be authenticated. But it’s still POST in essence.

And therein lies XigmaNAS’ problem. There is no curl or wget tooling available. And thus sending HTTP POST on embedded XigmaNAS is not possible. Or is it?

Well, here is the beauty of HTTP - it’s just a freaking text over TCP connection. And ancient (but still beloved) nc tool is good at exactly that - sending stuff over network. As long as you can “echo” stuff, you can redirect it to nc and pretend you have a proper HTTP client. Just don’t forget to set headers.

To cut the story short - here is my script using nc to push statistics from XigmaNAS to my Grafana setup. It’ll send basic CPU, memory, temperature, disk, and ZFS stats. Enjoy.

Mikrotik SNMP via Telegraf

As I moved most of my home to Grafana/InfluxDB monitoring, I got two challenges to deal with. One was monitoring my XigmaNAS servers and the other was properly handling Mikrotik routers. I’ll come back to XigmaNAS in one of later posts but today let’s see what can be done for Miktorik.

Well, Miktorik is a router and essentially all routers are meant to be monitored over SNMP. So, the first step is going to be turning it on from within System/SNMP. You want it read-only and you want to customize community string. You might also want SHA1/AES authentication/encryption but that has to be configured on both sides and I generally skip it for my home network.

Once you’re done you can turn on SNMP input plugin and data will flow. But data that flows will not include Mikrotik-specific stuff. Most notably, I wanted simple queues. And, once you know the process, it’s actually reasonably easy.

At heart of SNMP we have OIDs. Mikrotik is really shitty with documenting them but they do provide MIB so one can take a look. However, there is an easier approach. Just run print oid for any section, e.g.:

/queue simple print oid
 0
  name=.1.3.6.1.4.1.14988.1.1.2.1.1.2.1
  bytes-in=.1.3.6.1.4.1.14988.1.1.2.1.1.8.1
  bytes-out=.1.3.6.1.4.1.14988.1.1.2.1.1.9.1
  packets-in=.1.3.6.1.4.1.14988.1.1.2.1.1.10.1
  packets-out=.1.3.6.1.4.1.14988.1.1.2.1.1.11.1
  queues-in=.1.3.6.1.4.1.14988.1.1.2.1.1.12.1
  queues-out=.1.3.6.1.4.1.14988.1.1.2.1.1.13.1

This can than be converted into telegraf format looking something like this:

[[inputs.snmp.table.field]]
  name = "mtxrQueueSimpleName"
  oid = ".1.3.6.1.4.1.14988.1.1.2.1.1.2"
  is_tag = true
[[inputs.snmp.table.field]]
  name = "mtxrQueueSimpleBytesIn"
  oid = ".1.3.6.1.4.1.14988.1.1.2.1.1.8"
[[inputs.snmp.table.field]]
  name = "mtxrQueueSimpleBytesOut"
  oid = ".1.3.6.1.4.1.14988.1.1.2.1.1.9"
[[inputs.snmp.table.field]]
  name = "mtxrQueueSimplePacketsIn"
  oid = ".1.3.6.1.4.1.14988.1.1.2.1.1.10"
[[inputs.snmp.table.field]]
  name = "mtxrQueueSimplePacketsOut"
  oid = ".1.3.6.1.4.1.14988.1.1.2.1.1.11"
[[inputs.snmp.table.field]]
  name = "mtxrQueueSimplePCQQueuesIn"
  oid = ".1.3.6.1.4.1.14988.1.1.2.1.1.12"
[[inputs.snmp.table.field]]
  name= "mtxrQueueSimplePCQQueuesOut"
  oid= ".1.3.6.1.4.1.14988.1.1.2.1.1.13"

Where did I get the name from? Technically, you can use whatever you want, but I usually look them up from oid-info.com. Once you restart telegraf daemon, data will flow into Grafana and you can chart it to your heart’s desire.

You can see my full SNMP input config for Mikrotik at GitHub.

Monitoring Home Network

Illustration

While monitoring home network is not something that’s really needed, I find it always comes in handy. If nothing else, you get to see lot of nice colors and numbers flying around. For people like me, I need nothing more as encouragement.

Over time I tried many different systems but lately I fell in love with Grafana combined with InfluxDB. Grafana gives really nice and simple GUI while InfluxDB serves as the database for all the metrics.

I find Grafana hits just a right balance of being simple enough to learn basics but powerful enough that you can get into advanced stuff if you need it. Even better, it fits right into a small network without any adjustments needed to the installation. Yes, you can make it more complex later but starting point is spot on.

InfluxDB makes it really easy to push custom metrics from command line or literally anything that can speak HTTP and I find that really useful in heterogeneous network filled with various IoT devices. While version 2.0 is available, I actually prefer using 1.8 as it’s simpler in setup, lighter on resources (important if you run it in virtual machine), and it comes without GUI. Since I only use it as backend, that actually means I have less things to secure.

Installing Grafana on top of Ubuntu Server 20.04 is easy enough.

sudo apt-get install -y apt-transport-https
wget -4qO - https://packages.grafana.com/gpg.key | sudo apt-key add -
echo "deb https://packages.grafana.com/oss/deb stable main" \
    | sudo tee -a /etc/apt/sources.list.d/grafana.list

sudo apt update
sudo apt --yes install grafana

sudo systemctl start grafana-server
sudo systemctl enable grafana-server
sudo systemctl status grafana-server

That’s it. Grafana is now listening on port 3000. If you want it on port 80, some NAT magic is required.

sudo apt install --yes netfilter-persistent
sudo iptables -t nat -A PREROUTING -p tcp --dport 80 -j REDIRECT --to-port 3000
sudo netfilter-persistent save
sudo iptables -L -t nat

With Grafana installed, it’s time to get InfluxDB onboard too. Setup is again simple enough.

wget -4qO - https://repos.influxdata.com/influxdb.key | sudo apt-key add -
echo "deb https://repos.influxdata.com/ubuntu focal stable" \
    | sudo tee /etc/apt/sources.list.d/influxdb.list

sudo apt update
sudo apt --yes install influxdb

sudo systemctl start influxdb
sudo systemctl enable influxdb
sudo systemctl status influxdb

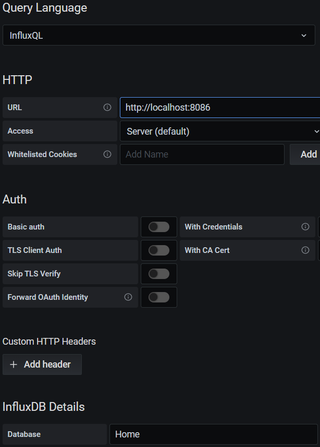
Once installation is done, the only remaining task is creating the database. In example I named it “telegraf”, but you can select whatever name you want.

curl -i -XPOST http://localhost:8086/query --data-urlencode "q=CREATE DATABASE ^^telegraf^^"

With both installed, we might as well install Telegraf so we can push some stats. Installation is again really similar:

wget -4qO- https://repos.influxdata.com/influxdb.key | sudo apt-key add -
echo "deb https://repos.influxdata.com/ubuntu focal stable" \
    | sudo tee /etc/apt/sources.list.d/influxdb.list

sudo apt-get update
sudo apt-get install telegraf

sudo sed -i 's*# database = "telegraf"$*database = "^^telegraf^^"*' /etc/telegraf/telegraf.conf
sudo sed -ri 's*# (urls = \["http://127.0.0.1:8086"\])$*\1*' /etc/telegraf/telegraf.conf
sudo sed -ri 's*# (\[\[inputs.syslog\]\])$*\1*' /etc/telegraf/telegraf.conf
sudo sed -ri 's*# (  server = "tcp://:6514")*\1*' /etc/telegraf/telegraf.conf

sudo systemctl restart telegraf
sudo systemctl status telegraf

And a minor update is needed for rsyslog daemon in order to forward syslog messages.

echo '*.notice action(type="omfwd" target="localhost" port="6514"' \
    'protocol="tcp" tcp_framing="octet-counted" template="RSYSLOG_SyslogProtocol23Format")' \
    | sudo tee /etc/rsyslog.d/99-forward.conf
sudo systemctl restart rsyslog

If you want to accept remove syslog messages, that’s also just a command away:

echo 'module(load="imudp")'$'\n''input(type="imudp" port="514")' \
    | sudo tee /etc/rsyslog.d/98-accept.conf
sudo systemctl restart rsyslog

That’s it. You have your metric server fully installed and its own metrics are flowing.

And yes, this is not secure and you should look into having TLS enabled at minimum, ideally with proper authentication for all your clients. However, this setup does allow you to dip your toes and see whether you like it or not.


PS: While creating graphs is easy enough, dealing with logs is a bit more complicated. NWMichl Blog has link to really nice dashboard for this purpose.