Tailing Two Files
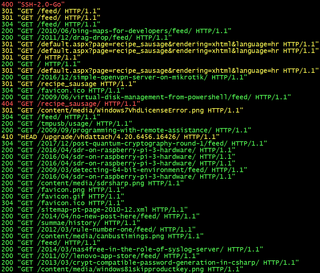
As I got my web server running, it came to me to track Apache logs for potential issues. My idea was to have a base script that would, on a single screen, show both access and error logs in green/yellow/red pattern depending on HTTP status and error severity. And I didn’t want to see the whole log - I wanted to keep information at minimum - just enough to determine if things are going good or bad. If I see something suspicious, I can always check full logs.
Error log is easy enough but parsing access log in the common log format (aka NCSA) is annoyingly difficult due to its “interesting” choice of delimiters.
Just looks at this example line:
108.162.245.230 - - [26/Dec/2017:01:16:45 +0000] "GET /download/bimil231.exe HTTP/1.1" 200 1024176 "-" "Mozilla/5.0 (Windows NT 10.0; WOW64; Trident/7.0; rv:11.0) like Gecko"First three entries are space separated - easy enough. Then comes date in probably the craziest format one could fine and enclosed in square brackets. Then we have request line in quotes, followed by a bit more space-separated values. And we finish with a few quoted values again. Command-line parsing was definitely not in mind of whoever “designed” this.
With Apache you can of course customize format for logging - but guess what? While you can make something that works better with command-line tools, you will lose a plethora of tools that already work with NCSA format - most notably Webalizer. It might be a bad choice for command line, but it’s the standard regardless.
And extreme flexibility of Linux tools also means you can do trickery to parse fields even when you deal with something as mangled as NCSA.
After a bit of trial and error, my final product was the script looking a bit like this:
#!/bin/bash

LOG_DIRECTORY="/var/www"

trap 'kill $(jobs -p)' EXIT

tail -Fn0 $LOG_DIRECTORY/apache_access.log | gawk '
  BEGIN { FPAT="([^ ]+)|(\"[^\"]+\")|(\\[[^\\]]+\\])" }
  {
    code=$6
    request=$5

    ansi="0"
    if (code==200 || code==206 || code==303 || code==304) {
      ansi="32;1"
    } else if (code==301 || code==302 || code==307) {
      ansi="33;1"
    } else if (code==400 || code==401 || code==403 || code==404 || code==500) {
      ansi="31;1"
    }
    printf "%c[%sm%s%c[0m\n", 27, ansi, code " " request, 27
  }
' &

tail -Fn0 $LOG_DIRECTORY/apache_error.log | gawk '
  BEGIN { FPAT="([^ ]+)|(\"[^\"]+\")|(\\[[^\\]]+\\])" }
  {
    level=$2
    text=$5 " " $6 " " $7 " " $8 " " $9 " " $10 " " $11 " " $12 " " $13 " " $14 " " $15 " " $16

    ansi="0"
    if (level~/info/) {
      ansi="32"
    } else if (level~/warn/ || level~/notice/) {
      ansi="33"
    } else if (level~/emerg/ || level~/alert/ || level~/crit/ || level~/error/) {
      ansi="31"
    }
    printf "%c[%sm%s%c[0m\n", 27, ansi, level " " text, 27
  }
' &

wait
Script tails both error and access logs, waiting for Ctrl+C. Upon exit, it will kill spawned jobs via trap.
For access log, gawk script will check status code and color entries accordingly. Green color is for 200 OK, 206 Partial Content, 303 See Other, and 304 Not Modified; yellow for 301 Moved Permanently, 302 Found, and 307 Temporary Redirect; red for 400 Bad Request, 401 Unauthorized, 403 Forbidden, and 404 Not Found. All other codes will remain default/gray. Only code and first request line will be printed.
For error log, gawk script will check only error level. Green color will be used for Info; yellow color is for Warn and Notice; red is for Emerg, Alert, Crit, and Error. All other (essentially debug and trace) will remain default/gray. Printout will consist just of error level and first 12 words.
This script will not only shorten quite long error and access log lines to their most essential parts, but coloring will enable one to see the most important issues at a glance - even when lines are flying around. Additionally, having them interleaved lends itself nicely to a single screen monitoring station.
[2018-02-09: If you are running this via SSH on remote server, don’t forget to use -t for proper cleanup after SSH connection fails.]
