Not Your Normal Random
When I test with random data I usually tend to use normal distribution. This particular time I didn’t want that. I wanted to simulate sensor readings and that means that I cannot have values going around all willy-nilly. I wanted sensors to read their default value most of time with occasional trips to edge areas. This is code I ended up with:
private static double GetAbnormalRandom() {
    double rnd = Rnd.NextDouble();
    double xh = 0.5 - rnd;
    double xs = xh * xh * 2;
    double x = 0.5 + Math.Sign(xh) * xs;
    if (x < 1) { return x; } else { return 0.5; }
}
2) This is just standard random number. Minimum value is 0 and maximum is LOWER than 1 (it can also be written as [0,1)).
3) I than moved this number to minimum of -0.5 and maximum lower than 0.5 ([-0.5,0.5)).
4) In order to maximize our mean value, I decided upon square function. It gives us number ranging from 0 to less than 0.5 (0.52 gives 0.25 and multiplication by 2 moves this back to 0.5).
5) Everything could stop here sine I have my distribution already available in step 4. However, I wanted to get everything back into [0,1) range. It is just matter of adding 0.5 to whatever number we got in step 4. Sign operation is here to ensure that half of numbers go to less than 0.5 and half of them go above.
6) Of course all this math is causing rounding to our floating point numbers. In rare occasions that can cause our step 4 to generate positive range number that is equal to 0.5. It is very rare (approximately 1 in 1000000) and we can just add it in middle.
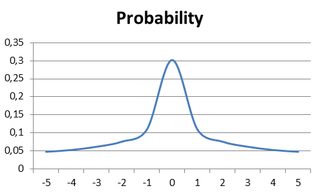
And this is it. Function will most probably return values around 0.5 with sharp drop in probability for values further toward edge (see graph).
For full code alongside some statistics you can download source code.
